

Summarize this guide with your preferred AI tool
Note: If prompt prefill is restricted by your browser, paste the copied prompt directly into the AI tool.
Table of Contents
- 1. Why Understanding Refund Reasons Matters
- 2. The 7 Most Common Shopify Refund Reasons
- Reason 1: Sizing & Fit Mismatches
- Reason 2: Item Does Not Match Visuals or Description
- Reason 3: Transit Damage & Packaging Failure
- Reason 4: Warehouse Picking & Fulfillment Errors
- Reason 5: Shipping Delays & Unmet Delivery Windows
- Reason 6: Manufacturing Defects & Early Malfunction
- Reason 7: Buyer's Remorse & Bracketing
- 3. How to Categorize Refund Reasons Consistently
- Reported Reasons vs. True Root Causes
- Establishing a Standardized Reason Taxonomy
- 4. How to Analyze Qualitative Customer Notes
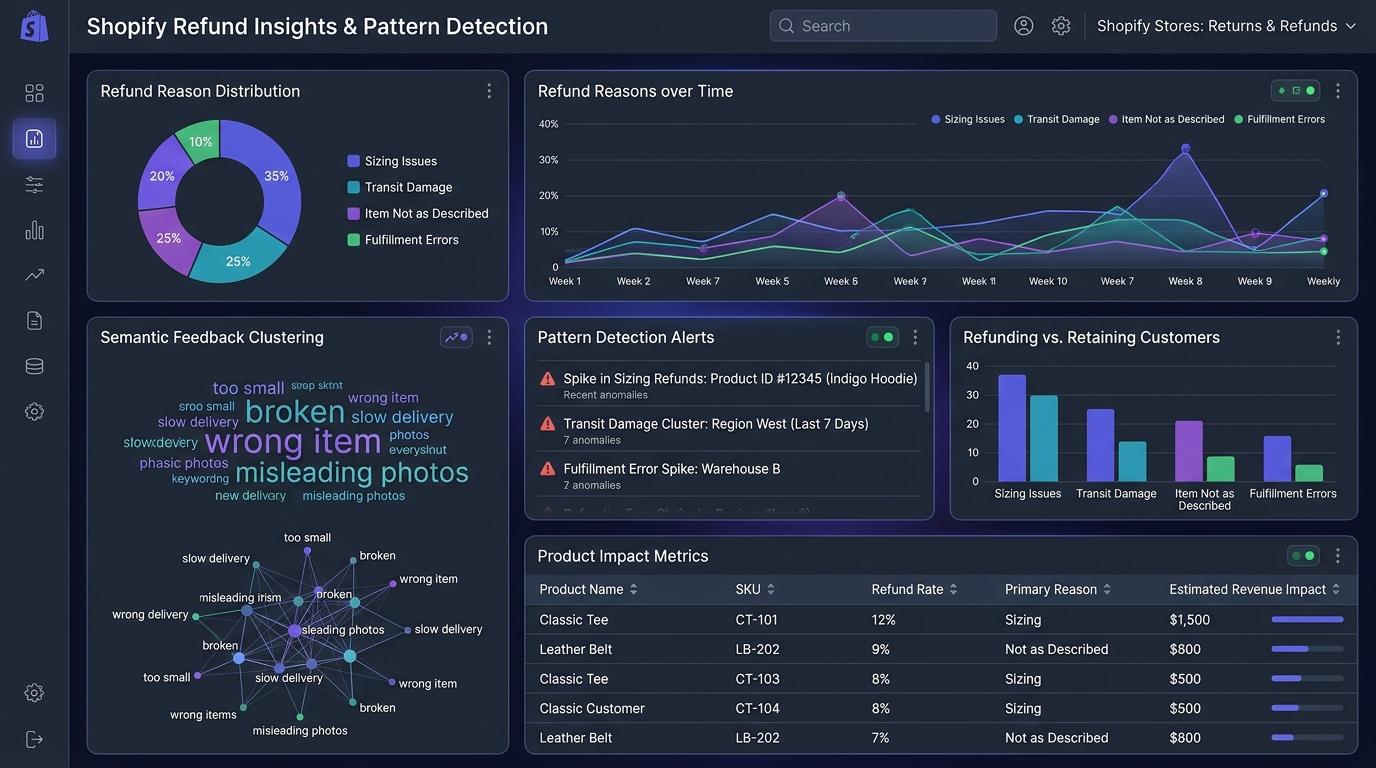
- Mining Free-Text Return Notes for Patterns
- 5. Distinguishing Product Flaws from Fulfillment Issues
- 6. How to Identify Recurring Catalog Patterns
- SKU Reason Concentration Matrix
- Variant-Level Reason Skew
- 7. Operational Remediation Matrix
- 8. How to Measure Whether Corrective Actions Work
- 9. Automating Reason Intelligence with RefundLens
- Frequently Asked Questions
- Conclusion
- About the Author
Key Insights on Shopify Refund Reasons
Refunds are financial outcomes; they are not root causes. Consumer surveys from PowerReviews and Narvar demonstrate that sizing mismatches, transit damage, and visual expectation gaps dominate why shoppers initiate returns. However, customer-selected reasons in return portals are often biased or incomplete. To sustainably lower your return rate, you must distinguish between customer-reported reasons and verified merchant root causes, separate product defects from fulfillment errors, and continuously track SKU-level reason clusters.
1. Why Understanding Refund Reasons Matters
Every refund issued from your Shopify admin represents an erosion of contribution margin. Beyond the immediate loss of top-line revenue, returns generate substantial hidden operational friction: payment gateway processing fees, unrecoverable outbound shipping, expensive return freight, warehouse inspection labor, restocking depreciation, and customer support overhead.
Yet many ecommerce brands treat refunds as an unavoidable post-purchase tax. When return volume spikes, management often resorts to blunt policy instruments, such as shortening return windows or imposing punitive restocking fees, that damage brand trust and suppress checkout conversion.
The reality is that refunds are an operational diagnostic signal. When customers return merchandise, they are highlighting a specific breakdown in your customer journey: ambiguous sizing charts, misleading studio lighting, inadequate shipping mailers, warehouse picking mispicks, or factory quality control flaws. By analyzing recurring refund reasons, merchants can fix the underlying problem at the source. If you have not yet evaluated where your baseline sits against standard category numbers, review our comprehensive breakdown of industry refund rate benchmarks.
Essential Operational Distinctions: Refunds vs. Returns vs. Exchanges vs. Chargebacks
2. The 7 Most Common Shopify Refund Reasons
Across millions of online retail transactions, customer return requests consistently concentrate around seven distinct operational friction points. Below is a detailed breakdown of each reason, accompanied by realistic merchant scenarios, diagnostic identification tactics, corrective actions, and key monitoring metrics.
Sizing, Fit, and Proportional Mismatches
Explanation: Sizing discrepancy is the single largest customer-reported driver of returns in apparel, footwear, and wearable accessories. In consumer return studies by Narvar (where 42% to 45% of shoppers cited poor fit as their primary return reason across categories) and PowerReviews’ dedicated apparel return survey (where up to 70% of clothing returners cited sizing or fit), sizing friction consistently dominates customer feedback. Because shoppers cannot physically try on items prior to purchase, variance between standard industry sizing and a brand’s actual garment cut leads directly to customer frustration.
Realistic Merchant Example:
A Shopify apparel brand sells a tailored denim jacket with a standard S/M/L sizing chart. However, the manufacturer used rigid 14oz non-stretch raw denim with high armhole grading. Customers purchasing their usual Medium find the chest restrictively tight, triggering a 32% return rate concentrated specifically in Medium and Large variants.
Product Does Not Match Description or Visual Representation
Explanation: This occurs when the physical product differs meaningfully from what was depicted on the Product Detail Page (PDP). Discrepancies often involve fabric feel, color temperature differences caused by intense studio flash, omitted product dimensions, or oversold feature claims.
Realistic Merchant Example:
A home decor merchant photographs an area rug under high-intensity 5600K studio strobe lighting, making it appear warm ivory and cream. In real-world customer homes with incandescent lighting, the rug appears cool taupe and grey. Dissatisfied customers return the rug citing “color completely wrong.”
Damaged in Transit or Fragile Packaging Failure
Explanation: Merchandise arriving broken, shattered, crushed, or leaking due to inadequate inner cushioning or rough carrier sorting. This issue is especially prevalent in ceramics, glassware, bottled cosmetics, and delicate electronics.
Realistic Merchant Example:
A direct-to-consumer skincare store ships glass serum droppers in lightweight poly mailers rather than corrugated cardboard boxes to save $0.85 on shipping. During holiday sorting, mailers are compressed under heavier parcels, shattering droppers and causing a 19% refund rate due to leaked liquids.
Warehouse Picking & Fulfillment Errors (Wrong Item Shipped)
Explanation: The customer ordered product A, but the warehouse shipped product B, or sent an incorrect size/color variant. Fulfillment mispicks are 100% operational and completely preventable.
Realistic Merchant Example:
A footwear merchant stores Black Oxford shoes and Navy Oxford shoes in adjacent bins with similar barcode labels. During holiday rush picking, warehouse staff repeatedly mispick Navy pairs for Black orders, resulting in dozens of immediate customer complaints and refunds.
Shipping Delays & Unmet Delivery Windows
Explanation: The product arrived intact, but delivered after the event, birthday, or holiday for which it was purchased. Shoppers refuse delivery or immediately initiate a refund because the item is no longer useful.
Realistic Merchant Example:
A personalized gift store promises “Delivered before Mother’s Day” on checkout for orders placed up to May 5th. However, customs delays on imported blanks push delivery to May 14th. Frustrated buyers reject the packages and demand full refunds.
Manufacturing Defects & Early Malfunction
Explanation: Items that arrive physically flawed or malfunction within the first few days of consumer usage, such as torn seams, broken zippers, electronics that fail to power on, or chipped finishes. Because acceptable quality thresholds differ substantially between complex multi-component electronics and basic apparel, merchants should compare SKU defect rates against their own historical product and supplier lot baselines rather than relying on an arbitrary universal percentage.
Realistic Merchant Example:
A leather bag store switches to a lower-cost hardware supplier. Within two weeks of delivery, customers report that the metal shoulder-strap clasps snap under ordinary weight. A sudden surge in “broken hardware” refunds impacts the entire collection.
Buyer’s Remorse, Unplanned Impulse Purchases & Bracketing
Explanation: The product is non-defective, matches the website, and arrived on time, but the buyer simply changed their mind, regretted spending the money, or purchased multiple items with the deliberate intention of returning the excess (“bracketing”).
Realistic Merchant Example:
A direct-to-consumer jewelry merchant runs an aggressive flash discount ad campaign on social media. Impulsive buyers make late-night purchases, but experience buyer’s remorse once the credit card statement posts, initiating returns stating “no longer needed.”
Merchants frequently suspect “wardrobing”: the practice of buying high-ticket apparel, formalwear, or accessories to wear once for a specific event or photoshoot before returning them for a full refund. According to landmark retail research by the National Retail Federation (NRF) and Appriss Retail (2023 Consumer Returns in the Retail Industry), return fraud and policy abuse cost US retailers an estimated $101 billion in 2023, representing $13.70 per $100 in returned merchandise.
Critical Editorial Guardrail: Merchants must strictly distinguish between suspected fraud and confirmed policy abuse. Suspecting an item was worn based solely on rapid return timing or Friday-purchase/Monday-return cycles is not proof. Confirmation requires physical warehouse inspection (e.g., perfume scent, makeup marks, detached tags, or missing components). Suspected wardrobing should be mitigated through proactive deterrence, such as conspicuous exterior 360-degree security tags that cannot be reattached once cut, rather than penalizing legitimate customers or making unsubstantiated accusations.
3. How to Categorize Refund Reasons Consistently
Many merchants fail to resolve refund patterns because their incoming data is an unorganized mess of vague dropdown options like “Other,” “Customer Request,” or blank reason fields. To diagnose catalog problems, you must establish an operational data taxonomy. For instructions on tracking native Shopify reports, see our merchant guide to how to analyze Shopify refunds step by step.
Never assume that the refund reason a customer selects in your returns portal is the actual operational truth. In ecommerce, customers routinely game return reason dropdowns. If your store policy states that returns for “Buyer’s Remorse” or “Fit” require a $7.00 return shipping deduction, but returns for “Defective Item” receive a free prepaid label, customers will strategically select “Defective” even when the garment simply did not fit.
Best Practice: Treat customer-provided reasons as a starting hypothesis, not ground truth. Conduct physical warehouse return inspections or photo validations to verify whether items marked “defective” truly have mechanical flaws.
Establishing a Standardized Reason Taxonomy
Replace open-ended or arbitrary reason tags with a clean two-tier taxonomy:
- • Product / Catalog Issue: Fit, quality, specs, photos.
- • Fulfillment / Logistics Issue: Mispick, late delivery, damage.
- • Customer Preference / Behavioral: Remorse, bracketing.
- • Garment Cut Runs Small (Bust / Inseam)
- • Color Shade Darker Than PDP Image
- • Transit Shock Glass Breakage
4. How to Analyze Qualitative Customer Notes
Quantitative return counts tell you how many refunds occurred; qualitative free-text customer notes reveal the exact frustration. When shoppers type return comments, customer support emails, or survey responses, they leave rich clues about why your product failed their expectations.
Mining Free-Text Return Notes for Patterns
Instead of reading hundreds of individual tickets manually, group recurring customer language into thematic semantic clusters:
5. How to Distinguish Product Problems from Fulfillment Problems
When a store experiences elevated refund rates, marketing and product teams often blame fulfillment, while fulfillment teams blame product quality. Disentangling these two root causes requires looking at how refund reasons distribute across your catalog:
Isolated to Specific SKUs: If 90% of your store operates at a healthy 8% refund rate, but one specific jacket suffers a 34% refund rate with notes citing “defective zipper” or “runs small,” you are dealing with a localized product design or supplier flaw. Fixing it requires product page revisions, factory pattern adjustments, or supplier renegotiation.
Distributed Across Diverse SKUs: If returns for “wrong size sent,” “missing components,” or “damaged carton” occur evenly across 150 different products, the issue is not in the merchandise. You are experiencing a systemic warehouse picking, packaging, or 3PL operational breakdown.
6. How to Identify Recurring Catalog Patterns
Rather than treating every customer refund as an isolated event, top ecommerce operators aggregate data to reveal recurring structural patterns across two dimensions:
1. SKU Reason Concentration
Examine what percentage of a single product’s refunds stem from a single reason. If 75% of refunds for a pair of linen trousers cite “transparent fabric,” the problem is clear and actionable. For an in-depth framework on ranking products by overall financial damage, explore our guide to finding which products cause the most refunds on Shopify.
2. Variant-Level Reason Skew
A product might look acceptable on average, but breaking down reasons by variant often exposes hidden issues. If Size XL and XXL variants generate 80% of all “too small” refund requests while Small and Medium generate none, your pattern grading for extended sizes is flawed.
7. Operational Remediation Matrix
Use this operational matrix to match identified refund reasons with proven corrective workflows:
| Refund Reason | Primary Root Cause | Corrective Action | Metric to Track |
|---|---|---|---|
| 1. Sizing / Fit Mismatch | Ambiguous size chart, lack of flat-lay garment measurements | Publish exact measurements, add model height/weight, add fit guidance | Variant-Level Return Rate % |
| 2. Item Not as Described | Studio flash distortion, omitted fabric texture/weight specs | Add unedited natural daylight photos, video clips, detailed fabric specs | “Not as Pictured” Ticket Share % |
| 3. Transit Damage | Thin poly mailers, inadequate interior bubble/pulp cushioning | Upgrade to 200 lb corrugated boxes, molded pulp inserts, cap shrink bands | Damage Claims / 1k Orders |
| 4. Fulfillment Mispicks | Manual bin picking errors during warehouse packing rush | Enforce mandatory 1D/2D barcode scan verification at packing stations | Warehouse Mispick Rate % |
| 5. Late Delivery | Over-promising delivery dates during peak holiday transit windows | Add 2-day buffer to checkout estimates, post holiday carrier deadlines | On-Time Carrier Delivery % |
| 6. Product Defect | Substandard component supplier hardware or assembly defects | Quarantine affected warehouse batch lots, enforce factory QA checklists | Defective Return Rate % |
| 7. Buyer’s Remorse | Impulsive social ad buying or multi-size consumer bracketing | Incentivize store credit with +$10 bonus, charge modest return shipping fee | Exchange vs. Refund Ratio |
8. How to Measure Whether Corrective Actions Work
Implementing a fix, such as updating a product description or upgrading mailer boxes, is only half the battle. You must measure whether your action actually reduced refund friction without harming sales:
Pre- and Post-Intervention Cohort Tracking
Record the exact date an operational change is pushed live. Compare orders placed in the 45-day window before the change against orders placed in the 45-day window after the change once the return window has matured. Track whether the specific reason (e.g., “too small”) declined as a proportion of total orders.
Conversion Rate Guardrails
Ensure your corrective action did not accidentally harm conversion. If you added a notice stating “Runs very small, dry clean only,” did the product’s sales conversion drop by 30%? A successful intervention preserves checkout conversion while measurably reducing post-purchase return rates.
9. Automating Reason Intelligence with RefundLens
Manually categorizing thousands of unstructured return notes in static spreadsheets is slow, reactive, and prone to human oversight. By the time a merchant discovers that a new supplier lot has defective zippers, hundreds of units have already shipped to customers.
RefundLens: AI Refund Insights connects directly to your Shopify store through an automated data ingestion workflow. It ingests order records, transaction logs, and customer return notes in real time. Using automated refund diagnostic features, RefundLens clusters customer comments into root-cause themes, flags variant skews, and alerts your merchandising team to emerging profit leaks before they escalate.
RefundLens is a dedicated post-purchase refund analytics and intelligence application. It analyzes historical order logs, return reasons, and SKU performance to identify actionable trends. RefundLens does not operate as a customer-facing returns portal, does not print shipping labels, does not automate financial refund approvals, and does not promise guaranteed fraud prevention or revenue recovery.
Frequently Asked Questions About Shopify Refund Reasons
Why do customers request refunds on Shopify?
Customers request refunds on Shopify for several distinct reasons, primarily related to sizing and fit mismatches, product descriptions or photos failing to match the physical item, transit packaging damage, warehouse fulfillment mistakes (wrong item sent), delivery delays, manufacturing defects, or buyer remorse. Identifying the precise cause requires looking beyond surface-level reason tags.
Can I trust the refund reason selected by the customer?
Customer-selected refund reasons are often incomplete or inaccurate. For instance, consumers frequently select 'defective' or 'not as described' in return portals simply to qualify for free return shipping or avoid restocking deductions, even when the real underlying driver was fit or buyer remorse. Merchants must verify physical items or review free-text notes to uncover true root causes.
What is the difference between a refund reason and a return reason?
A return reason explains why a physical product is shipped back to a warehouse (e.g., wrong size, defective zipper). A refund reason explains why funds were credited back to the customer. A refund can occur without a physical return (such as a returnless appeasement for damaged low-cost items, an order cancelled prior to fulfillment, or a chargeback dispute).
How do I separate product defects from fulfillment errors in Shopify?
Look at SKU concentration and fulfillment tracking. If a single SKU generates 85% of its returns due to zipper tears or fabric fraying across multiple production batches, it is a product design issue. If refunds span hundreds of unrelated SKUs for 'wrong item sent' or 'crushed box,' the issue originates in warehouse picking workflows or packaging protection.
How can Shopify merchants reduce returns caused by sizing issues?
Upgrade product detail pages with flat-lay garment measurements (chest, waist, hip, inseam), state model height and size worn, and add explicit fit advice (e.g., 'runs small through the bust, order one size up'). Integrating real customer review fit tags also drastically reduces bracket buying.
Does Shopify Admin automatically cluster customer refund notes?
Shopify Admin records order-level financial status and allows basic manual reason tags or free-text notes, but it does not natively perform semantic clustering or SKU-level pattern aggregation. Merchants must either manually export CSV files into spreadsheets or use dedicated refund intelligence software like RefundLens to automatically cluster feedback.
Conclusion
Refunds do not occur in a vacuum. Behind every refunded dollar lies an operational reason: an ambiguous size chart, a studio photo that misrepresented color undertones, a fragile bottle packed in a flimsy mailer, or an impulsive purchase that triggered regret.
By implementing a consistent reason taxonomy, looking beyond surface customer dropdowns to uncover true root causes, and distinguishing product defects from fulfillment mispicks, Shopify merchants can transform return feedback from an accounting loss into a roadmap for continuous catalog improvement.

Ketul Sindhwad
Digital Marketing & SEO Professional
Ketul Sindhwad is a Digital Marketing & SEO professional focused on ecommerce, analytics, and Shopify. He shares practical guides on understanding customer behavior, product performance, refunds, and other data that can help merchants make better decisions.