

Summarize this guide with your preferred AI tool
Note: If prompt prefill is restricted by your browser, paste the copied prompt directly into the AI tool.
Table of Contents
- 1. Choose a consistent date range
- 30-Day Window: Recent launches
- 90-Day Window: Baseline catalog health
- 12-Month Window: Seasonal patterns
- 2. Compare refund counts and rates
- Refund Rate Formula
- Volume vs. Rate Comparison
- 3. Understand financial impact
- Financial Impact Matrix
- 4. Examine product variants
- Variant-Level Return Rate Skew
- Variant Investigation Areas
- 5. Analyze reported refund reasons
- Connecting Reasons to Products
- Official Shopify Guidance
- 6. Identify patterns and investigate
- Practical Investigation Pathways
- Four Common Mistakes to Avoid
- Practical investigation checklist
- Analyzing product refunds in RefundLens
- Frequently asked questions
- Ketul Sindhwad
If your Shopify store is processing more refunds than you would like, your store-wide refund total only tells you that revenue is flowing back to customers. It does not reveal where operational friction is concentrated, which SKUs demand review, or what caused buyers to be dissatisfied in the first place.
To find which products truly cause the most refunds, merchants cannot rely solely on counting returns. Effective catalog analysis requires comparing five essential dimensions:
- Refund count: The absolute number of returns, reflecting warehouse processing workload.
- Refund rate: The percentage of orders returned, normalizing for sales popularity.
- Refund value: The total net dollar loss per SKU, measuring financial leakage.
- Product and variant patterns: Disproportionate return spikes on specific sizes, cuts, or colors.
- Reported refund reasons: Qualitative clues from customer feedback and reason codes indicating what on the product page or physical item needs attention.
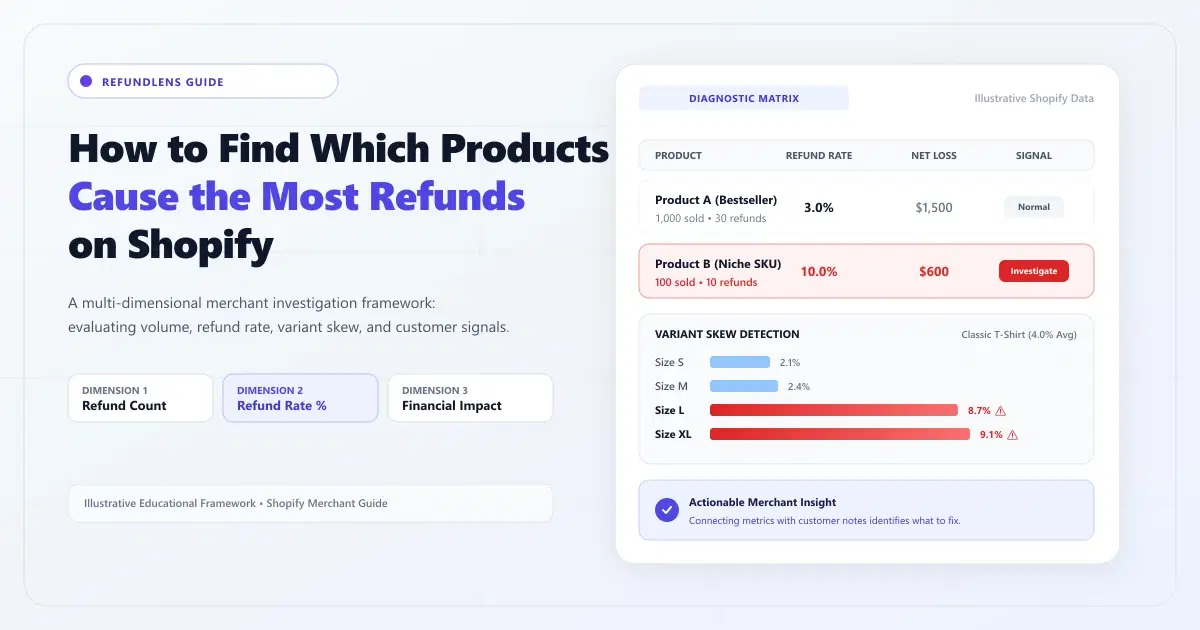
A high-volume bestseller with 30 refunds might actually maintain a very healthy 3.0% refund rate across 1,000 orders. Meanwhile, a niche product with only 10 refunds might carry a troubling 10.0% refund rate across 100 sales. Product-level analysis brings clarity to these distinctions so your team focuses effort where adjustments will have the highest operational and financial impact.
Key Takeaways
- Raw counts penalize bestsellers: Always calculate the refund rate relative to orders to normalize for sales popularity.
- Dollar value shifts priority: A premium product with moderate returns often represents far greater financial loss than a high-return low-cost item.
- Averages hide variant defects: A healthy 4% product average can conceal an 8% to 9% return rate concentrated in a single size or color variant.
- Customer notes explain what to fix: Quantitative metrics show where returns occur; customer return notes provide qualitative clues on why.
- Correlations are signals, not proof: High refund rates indicate where merchants should investigate product descriptions, size tables, and physical batches, rather than serving as automated proof of fault.
Table of Contents
- 1. Choose a consistent date range
- 30-Day Window: Recent launches
- 90-Day Window: Baseline catalog health
- 12-Month Window: Seasonal patterns
- 2. Compare refund counts and rates
- Refund Rate Formula
- Volume vs. Rate Comparison
- 3. Understand financial impact
- Financial Impact Matrix
- 4. Examine product variants
- Variant-Level Return Rate Skew
- Variant Investigation Areas
- 5. Analyze reported refund reasons
- Connecting Reasons to Products
- Official Shopify Guidance
- 6. Identify patterns and investigate
- Practical Investigation Pathways
- Four Common Mistakes to Avoid
- Practical investigation checklist
- Analyzing product refunds in RefundLens
- Frequently asked questions
- Ketul Sindhwad
1. Choose a consistent date range
Before calculating any product-level refund numbers, ensure all orders and returns are evaluated across a uniform date window. Comparing 30-day refund counts for one SKU against 90-day numbers for another skews conclusions and leads to wasted operational effort.
Select an evaluation window aligned with your catalog volume and recent changes:
30-Day Window: Recent launches and adjustments
Best suited for newly introduced products, recently received supplier batches, or measuring the impact of recent size chart revisions.
90-Day Window: Reliable catalog baseline
Provides a dependable statistical baseline for core catalog products while smoothing out short-term promotional fluctuations and fulfillment anomalies.
12-Month Window: Seasonal and holiday patterns
Essential for seasonal apparel, outerwear, swimwear, or holiday gift items that experience compressed sales and post-season return cycles.
Seasonal surges and temporary shipping carrier delays can artificially concentrate returns into brief windows. Evaluating products against consistent timeframes allows you to separate temporary delivery spikes from persistent product description issues.
2. Compare refund counts and refund rates
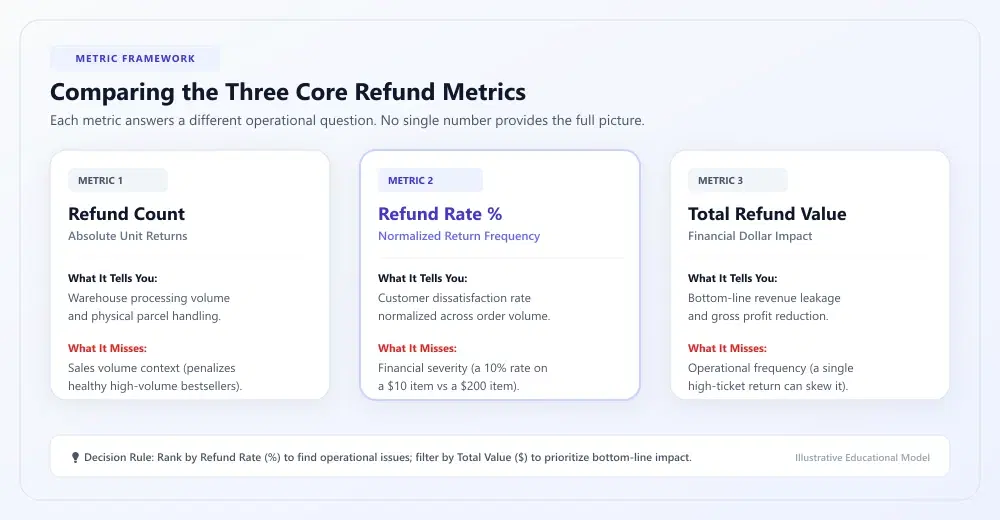
Relying exclusively on raw refund counts penalizes your most popular products. Bestsellers naturally accumulate more returns in absolute numbers simply because they generate significantly higher order volume. For a comprehensive overview of reporting metrics and data extraction, see our guide on the foundations of Shopify refund analysis.
To compare high-volume and low-volume products fairly, calculate each item's percentage refund rate:
Refund Rate (%) = (Refunded Orders ÷ Total Orders) × 100
| Product | Total Orders | Refunded Orders | Refund Rate |
|---|---|---|---|
| Product A (Bestseller) | 1,000 | 30 | 3.0% |
| Product B (Niche SKU) | 100 | 10 | 10.0% |
| Product C (Mid-tier) | 500 | 12 | 2.4% |
In this illustrative example, Product A produces the highest return count (30 refunds), but its 3.0% refund rate is typical for its category. Product B only had 10 refunds, but its 10.0% return rate is more than triple the baseline, representing a much stronger operational signal to investigate.
3. Understand financial impact
Rate and count indicate frequency and volume, but total dollar value reveals net financial loss. A premium $150 outerwear item returned 15 times creates far more bottom-line leakage than a $20 accessory returned 30 times.
Factoring refund dollar value into your SKU prioritization changes which products you inspect first:
| Product | Refunded Orders | Refund Rate | Total Refund Value | Primary Operational Signal |
|---|---|---|---|---|
| Product A | 30 | 3.0% | $1,500 | High warehouse return handling volume |
| Product B | 10 | 10.0% | $600 | High customer friction and sizing mismatch |
| Product C | 15 | 4.0% | $2,100 | Highest direct revenue loss |
Prioritizing products by financial leakage prevents teams from spending weeks refining low-cost accessories while high-dollar items silently drain revenue.
4. Examine product variants
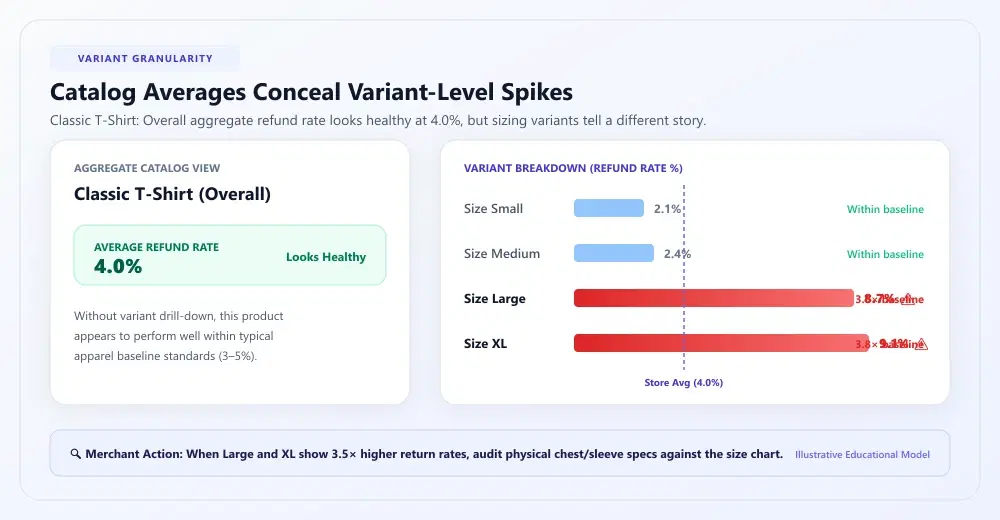
Catalog-level averages frequently obscure variant-specific flaws. An apparel SKU might maintain an acceptable 4.0% aggregate refund rate while a single size or color option experiences an extreme return spike. Modern analytics apps offer specialized variant skew analysis tools to isolate these discrepancies before they impact overall store profitability.
Consider this breakdown for an apparel SKU with a 4.0% overall return rate:
| Product | Variant Option | Variant Refund Rate | Evaluation |
|---|---|---|---|
| Classic T-Shirt | Small / Black | 2.1% | Within healthy baseline |
| Classic T-Shirt | Medium / Black | 2.4% | Within healthy baseline |
| Classic T-Shirt | Large / Black | 8.7% | 3.6× baseline; review size chart |
| Classic T-Shirt | XL / Black | 9.1% | 3.8× baseline; review fit notes |
Variant Investigation Areas
When a specific variant produces elevated returns, check these concrete investigation areas:
- Size charts and measurement guides: Verify whether physical garment chest, waist, or sleeve measurements match the published sizing table.
- Fit descriptions and model notes: Explicitly state whether the garment runs fitted, relaxed, or true-to-size, and provide the model's height and size worn.
- Color swatch photography: Check whether studio lighting made a navy appear black or altered fabric undertones.
- Batch manufacturing variations: Confirm whether a new supplier run altered dimensions or material tolerances for larger cuts.
Important distinction: Higher refund rates on specific sizes do not prove the physical item is defective. They indicate where product page expectations, photography, or measurement tables deserve verification.
5. Analyze reported refund reasons
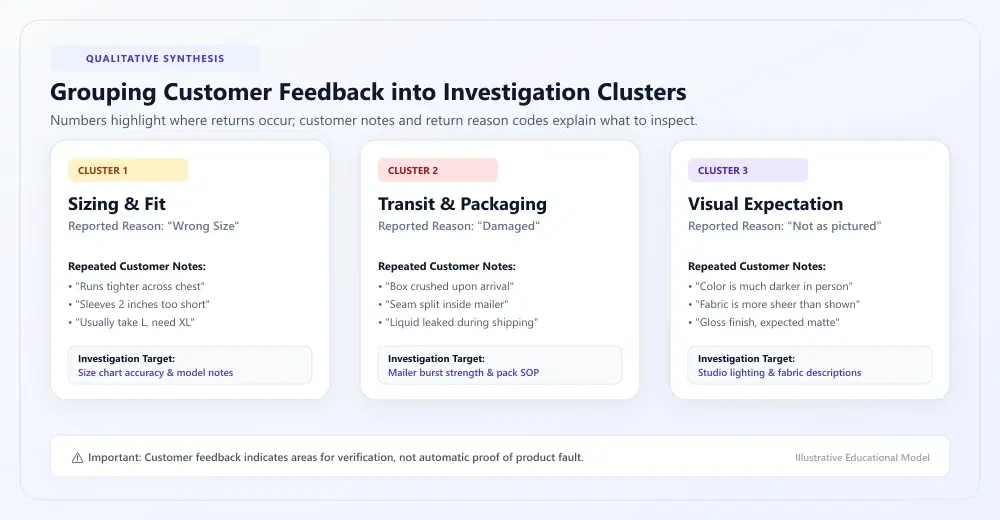
Product numbers show where refunds are concentrated. Customer return reason codes and unstructured note text provide the qualitative context to understand what to fix.
| Product | Reported Return Reason | Refunded Orders |
|---|---|---|
| Classic T-Shirt | Wrong size | 14 |
| Classic T-Shirt | Didn't match expectations | 8 |
| Running Shoes | Damaged in transit | 12 |
| Winter Jacket | Changed mind | 7 |
6. Identify patterns and decide what to investigate
A single refund note is rarely informative on its own. Stronger starting points emerge when multiple analytical signals align around the same product:
- Consistent SKU appearance: The same product repeatedly surfaces across consecutive 30-day and 90-day review windows.
- Variant concentration: Refunds disproportionately cluster in one or two sizes or colors rather than spreading evenly across options.
- Repeated customer feedback: Multiple buyers report the same observation (such as "runs tight in shoulders" or "fabric is sheer").
- Upward trend relative to orders: The product's refund rate is climbing faster than its sales volume.
Practical Merchant Investigation Pathways
Sizing Feedback
- • Verify physical garment dimensions
- • Update measurement chart tables
- • Clarify tight vs. loose fit style
- • Add model height & size details
Damage Feedback
- • Test mailer & box burst strength
- • Review warehouse packing SOPs
- • Audit supplier quality checks
- • Check transit carrier handling
Expectation Feedback
- • Re-calibrate photography lighting
- • List material fabric weight (GSM)
- • Clarify finish (matte vs sheen)
- • Update description specifications
Four Common Mistakes to Avoid
1. Looking only at raw refund counts
Counting refunds without factoring in order volume leads stores to mistakenly flag high-volume bestsellers that actually maintain healthy return percentages.
2. Ignoring low-volume sample sizes
A product with 2 refunds out of 2 sales (100% rate) has insufficient statistical volume to declare a defect. Look for patterns across meaningful order quantities.
3. Treating an isolated complaint as a trend
One customer's subjective comment does not represent a systemic catalog issue. Look for repeated mentions across multiple customers before changing content.
4. Assuming analytics prove root cause
Refund metrics highlight where to direct human attention. They indicate where to investigate, not an automated diagnosis of why customers returned an item.
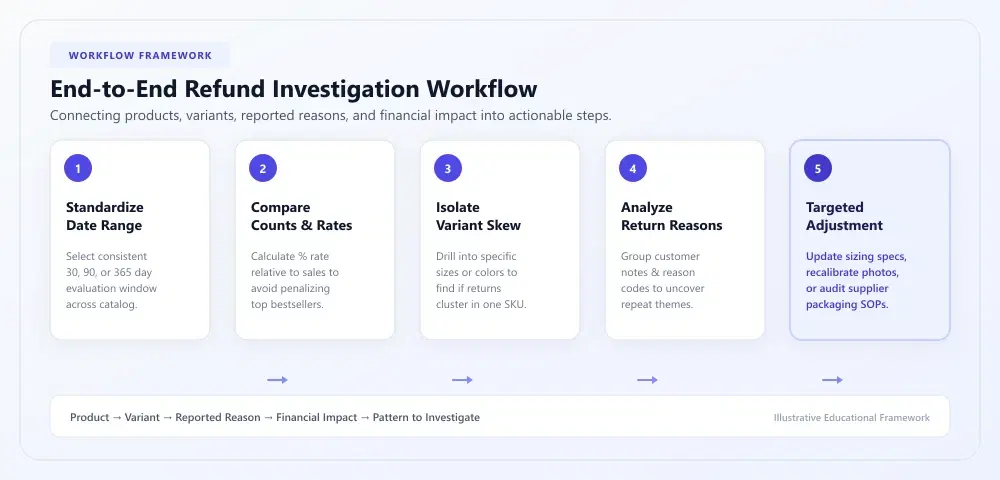
Practical investigation checklist
Use this simple checklist during your monthly or quarterly catalog reviews:
Standardize date range: Select a consistent 30, 60, or 90-day window across all comparative reports.
Rank by return rate (%): Identify SKUs where return frequency significantly exceeds your store average.
Evaluate total dollar leakage: Calculate net refunded dollars per SKU to measure financial impact.
Inspect size and color variants: Verify whether one variant option is responsible for a product-level spike.
Synthesize customer notes: Group reported reason codes and unstructured feedback into common buckets.
Verify product detail accuracy: Cross-check customer feedback against published photos, descriptions, and size charts.
Monitor post-update stability: Track SKU refund rates for 30 to 60 days after updating product page copy to verify trend direction.
Analyzing product refunds in RefundLens: AI Refund Insights
For stores with a small catalog, this multi-step analysis can be managed through regular manual CSV exports. However, as your catalog expands across hundreds of size and color variants, compiling order lines, return codes, customer notes, and rates by hand becomes tedious to sustain.
RefundLens helps merchants analyze refund data and identify patterns worth investigating. It connects securely with your Shopify store to organize product-level refund activity automatically, calculate variant return rates, highlight repeat feedback themes, and summarize financial impact in clear views so your team can focus on making catalog improvements rather than assembling spreadsheets.
Frequently asked questions
How do I find which Shopify products have the most refunds?
Compare total refund counts, calculate percentage refund rates relative to orders, inspect individual variant options, and review reported customer return reasons across a consistent date range.
Should I focus on refund count or refund rate?
Both are needed. Refund count indicates operational warehouse volume, while refund rate normalizes for order popularity to reveal SKUs returning at unusually high frequencies relative to sales.
How do I calculate the refund rate for a specific product?
Divide the number of refunded orders for that product by the total number of orders placed for that product during the same evaluation period, then multiply by 100.
How can I find why customers are refunding a specific product?
Inspect customer-reported return reason codes and unstructured notes attached to refund records to identify repeat themes such as sizing discrepancies, transit damage, or expectation mismatches.
Does a high refund rate prove there is a defective product?
No. A high refund rate is an operational signal that highlights a product worth investigating. It does not establish a definitive root cause without verifying the physical item and product page content.
How to Analyze Shopify Refunds: A Practical Guide for Merchants
Learn how to locate refunded orders in your Shopify admin, calculate refund rates, categorize recorded reasons, and evaluate trends over time.

Ketul Sindhwad
Digital Marketing & SEO Professional
Ketul Sindhwad is a Digital Marketing & SEO professional focused on ecommerce, analytics, and Shopify. He shares practical guides on understanding customer behavior, product performance, refunds, and other data that can help merchants make better decisions.