

Summarize this guide with your preferred AI tool
Note: If prompt prefill is restricted by your browser, paste the copied prompt directly into the AI tool.
Table of Contents
- 1. What Is an Ecommerce Refund Rate?
- 2. Refund Rate vs. Return Rate vs. Refund Dollar Value
- Physical Returns vs. Monetary Settlements
- Why Dollar Value Diverges from Unit Rates
- 3. How to Calculate Refund Rate: Standard Formulas
- Order-Based Refund Rate Formula
- Unit-Based Refund Rate Formula
- Net Dollar Value Refund Rate Formula
- Accounting for Return Window Lag
- 4. Industry Differences in Refund Rates
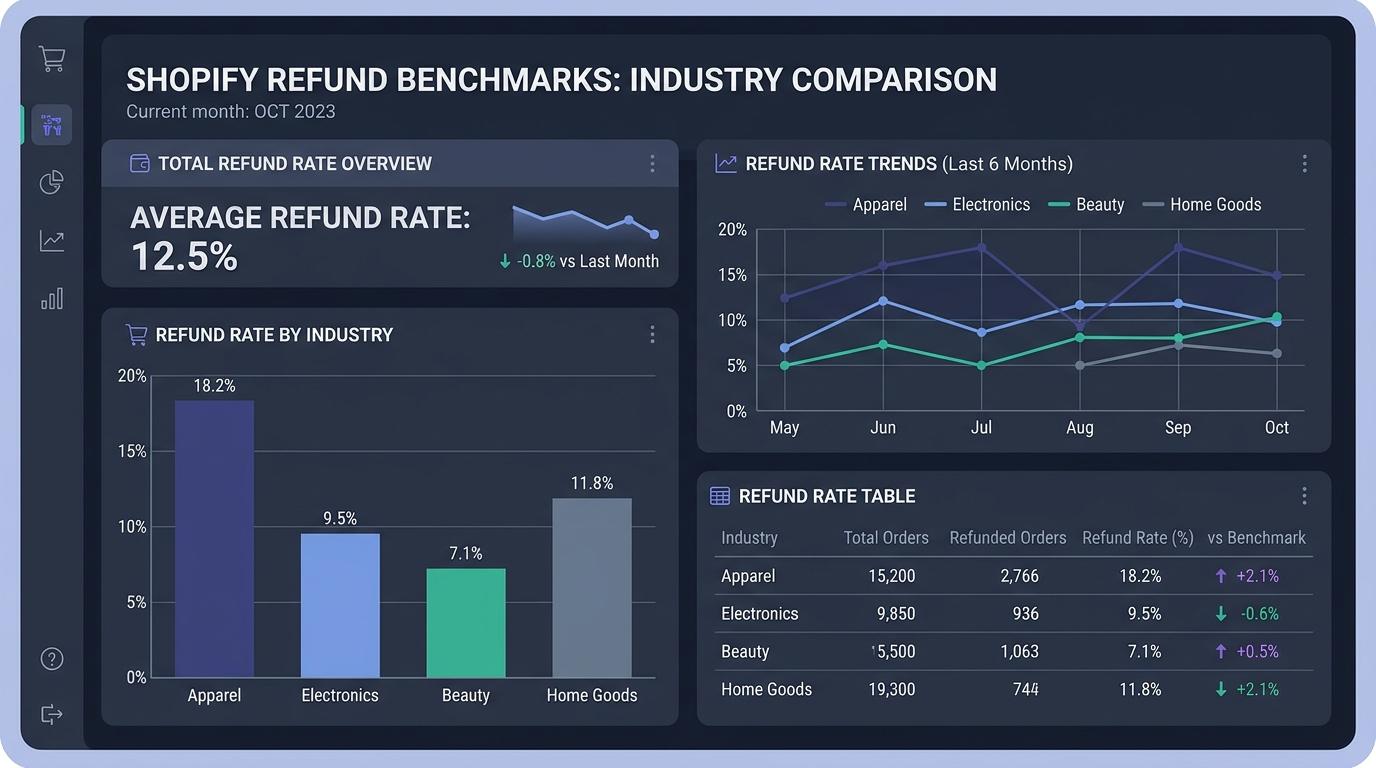
- Industry Benchmark Comparison Table
- Apparel & Fashion (20% – 30%)
- Consumer Electronics (8% – 15%)
- Beauty & Personal Care (4% – 9%)
- Home Decor & Bulky Furniture (8% – 23%)
- Data Sources & Benchmark Limitations
- 5. Why Refund Rates Vary Widely Across Stores
- Product Tactility & Sizing Uncertainty
- Return Policy Friction vs. Generosity
- Customer Acquisition Channel & Buyer Intent
- Holiday Seasonality & Q1 Peak Returns
- 6. Interpreting Refund Rates Without Misleading Comparisons
- The Deceptive Storewide Average Trap
- The Law of Small Numbers on New SKUs
- 7. Identifying Products and Variants Driving Refund Rates
- Volume vs. Rate Concentration Matrix
- Variant-Level Skew Diagnostics
- Clustering Customer Reason Feedback
- 8. Monitoring Refund Trends Over Time
- Rolling 30, 60, and 90-Day Baselines
- Monitoring Post-Action Rate Shifts
- 9. Practical Actions to Lower Refund Rates
- Automating Diagnostics with RefundLens
- Frequently Asked Questions
- Conclusion
- About the Author
Key Benchmark Takeaways for Shopify Merchants
Ecommerce return rates vary dramatically by product category. Across published retail data from the National Retail Federation (NRF) and Appriss Retail, online return rates averaged 17.6% in 2023 and 14.5% in 2024. However, online apparel consistently experiences return rates between 20% and 30%, while non-sized categories like beauty and cosmetics stay under 8%. Measuring your performance against a blended storewide average masks underlying SKU-level variance.
1. What Is an Ecommerce Refund Rate?
An ecommerce refund rate is the proportion of completed customer transactions, shipped product units, or gross sales revenue that a merchant returns to buyers over a specified operational period. In online retail, refunds represent the financial reversal of commerce transactions.
For merchants operating on Shopify, tracking your refund rate serves as an essential pulse check on product-market expectations, catalog description accuracy, fulfillment precision, and post-purchase customer satisfaction. When buyers repeatedly reverse purchases, the cause often traces back to friction occurring long before the checkout button was pressed, such as misleading product imagery, ambiguous sizing charts, or delayed delivery timelines.
However, many brand operators make the mistake of evaluating their store against vague industry hearsay or treating all returns and refunds as interchangeable figures. Before comparing your business against published benchmarks, it is vital to establish strict analytical definitions. For a deeper look at accessing and categorizing your transaction data inside the admin, review our comprehensive guide to how to analyze Shopify refunds step by step.
2. Refund Rate vs. Return Rate vs. Refund Dollar Value
In casual ecommerce conversations, “return rate” and “refund rate” are frequently used as synonyms. In accounting and operations, however, they represent distinct mechanisms with fundamentally different operational and financial consequences.
Physical Returns vs. Monetary Settlements
A physical return involves reverse logistics: the customer ships merchandise back to your warehouse or third-party logistics (3PL) provider. The inventory must be received, inspected, graded, cleaned, and either restocked or liquidated.
A refund, by contrast, is a purely financial event in which cash or credit is transferred back to the customer’s payment method. While physical returns often trigger refunds, the two metrics diverge in several critical scenarios:
- • Returnless appeasements: Low-cost or bulky items where return shipping exceeds item salvage value.
- • Damaged or defective goods: Items broken in transit where return shipping serves no purpose.
- • Order cancellations: Buyers cancelling before fulfillment or warehouse dispatch.
- • Chargebacks & payment disputes: Direct reversals forced through credit card processors.
- • Variant & size exchanges: Swapping a medium sweater for a large without refunding cash.
- • Store credit & gift cards: Retaining customer cash flow while issuing digital merchandise credit.
- • Warranty replacements: Sending duplicate replacement units for defective electrical components.
- • Bonus item returns: Returning promotional gifts that carried zero monetary purchase price.
Why Dollar Value Diverges from Unit Rates
A store might maintain a modest 8% unit refund rate, but suffer a devastating 19% dollar refund rate. This occurs when refund behavior correlates with price point. In apparel, for instance, premium outerwear and formal dresses with $200+ price tags often see much higher return scrutiny than $18 cotton tees. If your high-ticket SKUs generate disproportionate return volume, evaluating unit percentages alone will lull your finance team into a false sense of security.
3. How to Calculate Refund Rate: Standard Formulas
To accurately evaluate your performance against industry benchmarks, you must use standardized calculation methodologies. There are three core ways ecommerce operators calculate refund rates.
Order-Based Refund Rate
Example: If your Shopify store received 2,000 orders in a quarter and 240 of those orders experienced a full or partial refund, your order-based refund rate is 12.0%. This metric measures the frequency of transactions encountering post-purchase friction.
Unit-Based Refund Rate
Example: If you sold 6,500 units across all SKUs and refunded 650 units, your unit refund rate is 10.0%. This calculation is ideal for diagnosing product catalog quality, sizing accuracy, and SKU-level performance.
Net Dollar Value Refund Rate
Example: If your store generated $150,000 in gross sales and refunded $24,000 to buyers, your dollar refund rate is 16.0%. This represents the actual revenue erosion hitting your contribution margin.
A common reporting blunder is dividing December’s total refund dollars by December’s gross sales. Customers rarely refund orders on the same day they purchase. Because shipping and trial periods create a 2 to 4-week lag, December sales generate refunds in January. Dividing December refunds (largely originating from lower November volume) by massive December sales produces an artificially suppressed refund rate, followed by an alarming artificial spike in January.
Best Practice: Use cohort-based analysis. Track orders placed in a given month and tally the refunds that originate specifically from that cohort over the subsequent 45 to 60 days.
4. Industry Differences in Refund Rates: What Is Normal?
When merchants ask, “What is a normal return rate for Shopify?”, the only honest answer is: it depends entirely on what you sell. Physical products that require bodily fit, tactile assessment, or complex technical setup face fundamentally higher return rates than standardized commodities.
Ecommerce Return Rate Benchmarks by Industry (2026 Reference Data)
Compiled from published retail research including the National Retail Federation (NRF) / Appriss Retail Consumer Returns Reports, Narvar State of Returns, and logistics data.
| Industry / Vertical | Typical Online Return Rate | Primary Return Drivers | Key Documented Sources |
|---|---|---|---|
| Apparel & Fashion | 20% – 30% (Up to 35%+ in formalwear) | Sizing mismatch, fit variation, wardrobing / bracketing, screen color variance | NRF / Appriss Retail Consumer Returns Reports, Narvar State of Returns |
| Consumer Electronics | 8% – 15% | Technical setup confusion, wireless pairing friction, buyer remorse, missing cords | Accenture Electronics Return Study, Appriss Retail, Statista |
| Beauty & Personal Care | 4% – 9% (Often <6% for sealed skincare) | Allergic skin reactions, unexpected pigment shade mismatch, transit pump leakage | Kodif Omnichannel Beauty Benchmarks, Statista, Shopify Enterprise |
| Home Decor & Housewares | 8% – 14% | Color and lighting undertone discrepancy, tabletop dimension mismatch, transit breakage | NRF / Appriss Retail Hardlines & Housewares Sector Benchmarks |
| Online Bulky Furniture & Case Goods | 15% – 23% | Spatial fit failure (doorway/room scale), assembly friction, heavy freight handling damage | Freight & E-Commerce Reverse Logistics Benchmarks (ShipNetwork, FirstChair) |
Apparel & Fashion (20% – 30%)
Online apparel represents the highest return rate sector in global ecommerce. Because customers cannot try on garments before purchase, their bedrooms become the fitting room. According to consumer research published by Narvar across their State of Returns reports (sampling over 2,000 US online shoppers), between 58% and 63% of online apparel shoppers admit to “bracketing”: purchasing multiple sizes, cuts, or colors of the same garment with the deliberate plan to return whatever fails to fit. For apparel merchants, a 20% to 25% return rate is not necessarily an indicator of manufacturing defects; it is a structural reality of digital apparel retailing.
Consumer Electronics (8% – 15%)
Electronics return rates typically hover in the 8% to 15% bracket. What makes electronics returns uniquely perilous is high operational processing overhead and secondary depreciation. When a customer opens a sealed gadget box, the merchant cannot restock it as new inventory without rigorous testing, data wiping, and repackaging as open-box merchandise. In landmark electronics supply chain research by Accenture (“A Returning Problem: Reducing the Quantity and Cost of Product Returns in Consumer Electronics”), laboratory testing revealed that approximately 68% of returned consumer electronics exhibited “No Trouble Found” (NTF); buyers returned devices due to installation friction, wireless pairing confusion, or buyer remorse, while genuine physical hardware defects accounted for only about 5% of returns.
Beauty & Personal Care (4% – 9%)
Beauty, skincare, and cosmetics enjoy the lowest return rates among consumer goods, rarely exceeding 9% and frequently staying under 6% for sealed skincare lines. This is driven heavily by hygiene regulations and strict merchant return policies. Most cosmetics retailers explicitly state that unsealed, opened, or sampled skincare cannot be returned for a cash refund. When refunds do occur in beauty, they are frequently returnless resolutions granted for adverse skin reactions, damaged container pumps, or inaccurate cosmetic shade matching.
Home Decor & Bulky Furniture (8% – 23%)
In the home furnishings sector, return behavior diverges sharply between small parcel accessories and heavy freight case goods. Standard home decor, textiles, lighting, and housewares benchmark between 8% and 14% (with NRF/Appriss Retail tracking housewares at an average 11.5% return rate). Conversely, online-exclusive bulky furniture (sofas, dining tables, bed frames, mattresses) routinely reaches 15% to 23%. In bulky furniture, return friction is amplified by freight logistics costs: two-way freight on a heavy sofa can cost $100+ to $150+, wiping out operating margins. Returns in this segment are overwhelmingly driven by dimensional fit failure (the customer did not verify doorway clearance or room proportions) and screen color mismatches.
The benchmarks summarized in this guide originate from reputable primary research reports, including the Consumer Returns in the Retail Industry annual surveys published jointly by the National Retail Federation (NRF) and Appriss Retail (sampling dozens of retail brands and hundreds of billions in annual retail merchandise), consumer logistics surveys from Narvar (State of Returns consumer reports sampling over 2,000 online shoppers), supply chain research by Accenture on consumer electronics return lifecycles, and merchant cohort data from returns management platforms such as Loop Returns.
Critical Analytical Limitations:
- Geographic focus: Most published datasets reflect United States and North American retail, where free returns have historically been culturally expected. European and APAC markets often exhibit lower baseline return rates due to stricter statutory return shipping fee policies.
- Sample skew: NRF and Appriss surveys sample large enterprise retailers alongside mid-market brands. A bootstrapped Shopify DTC brand selling artisanal ceramics operates under very different unit economics than a multi-billion-dollar department store chain.
- No universal Shopify benchmark: Shopify hosts millions of stores across 175+ countries. Because merchant models range from high-fashion luxury to customized print-on-demand, there is no single “official Shopify platform average.” You must benchmark your store against direct category competitors rather than generalized platform folklore.
5. Why Refund Rates Vary Widely Across Individual Stores
Even within the same vertical, two Shopify stores selling similar products can experience wildly different refund rates (one operating comfortably at 14% while the other bleeds margin at 29%). Four primary operational levers explain these divergences:
1. Product Tactility & Sizing Uncertainty
Products with complex physical fit, tactile fabric textures, or tight tolerances trigger high return friction. Stores that provide precise garment flat-lay measurements, 3D model videos, and explicit customer review fit tags (“runs small in shoulders”) routinely experience return rates 4 to 7 percentage points lower than stores offering generic S/M/L sizing tables.
2. Return Policy Friction vs. Generosity
Return policies represent a delicate trade-off between checkout conversion and reverse logistics costs. Stores offering 60-day “free returns with prepaid labels” see higher conversion rates, but suffer higher return volumes. Case studies and merchant cohort analyses published by returns platforms like Loop Returns indicate that charging a modest return shipping fee ($6 to $10) or restocking deduction typically reduces return initiation by 20% to 30%, as consumers become more deliberate before ordering.
3. Acquisition Channel & Buyer Intent
Traffic intent dramatically dictates refund rates. Customers arriving through high-intent organic search or email newsletters have researched your brand and demonstrate return rates 30% lower than impulse shoppers acquired through aggressive, discount-driven paid TikTok or Instagram ads. Cold social ad traffic consistently generates the highest buyer’s remorse.
4. Holiday Seasonality & Q1 Peak Returns
Return rates follow predictable seasonal waves. During Q4 holiday shopping (Black Friday, Cyber Monday, Christmas), gift givers buy products without knowing the recipient’s exact sizing or taste preferences. Consequently, carrier data from major shipping networks like UPS (which annually tracks “National Returns Day” in early January) and post-holiday retail surveys from the NRF consistently document that January experiences the year’s sharpest surge in return package volumes as consumers exchange and return holiday merchandise.
6. How to Interpret Refund Rates Without Misleading Comparisons
When executives look at a monthly analytics dashboard, they often fixate on a single blended number: “Our storewide refund rate is 13.4%.” Treating this blended aggregate as proof that your catalog is healthy is one of the most perilous analytical traps in ecommerce.
The Deceptive Storewide Average Trap
A healthy storewide average frequently obscures severe catalog bleeding. Consider a hypothetical apparel store with an overall 14% refund rate. A superficial glance suggests performance well within normal apparel benchmarks. But when you disaggregate the catalog by SKU:
The blended average made the store look healthy, while Segment B was silently eroding company profits. To see how to systematically rank and isolate these high-impact products, consult our tactical guide to finding which products cause the most refunds on Shopify.
The Law of Small Numbers on Newly Launched SKUs
Another frequent analytical error is overreacting to low-volume percentages. If a newly launched product sells 5 units and experiences 2 returns, its recorded refund rate is 40.0%. Panicking and altering size charts based on 2 customer records is premature. You must establish a minimum statistical threshold (e.g., minimum 30 to 50 orders) before treating percentage return rates as reliable diagnostic signals.
7. How to Identify Products and Variants Driving Refund Rates
Rather than attempting to overhaul your entire store, the most profitable approach is isolating the small subset of SKUs responsible for the majority of refund dollars. A rigorous diagnostic framework combines three layers of investigation:
Layer 1: The Volume vs. Rate Matrix
Plot your catalog onto a 2x2 matrix comparing unit sales volume against percentage refund rate. Your highest priority for remediation is the “High Volume, High Refund Rate” quadrant. These hero products generate substantial gross revenue, but their elevated return rates generate enormous customer service overhead, shipping leakage, and restocking losses.
Layer 2: Variant-Level Skew Diagnostics
Products rarely fail uniformly across all variants. A dress might have an acceptable 15% overall refund rate, but when you break down performance by size, Size Small has a 6% return rate while Size XXL suffers a 44% return rate. This distinct variant skew points directly to a sizing grading error in the pattern design for extended sizes, rather than a flaw in the overall garment design. Discovering these patterns requires multi-dimensional refund diagnostic features that slice data by SKU and variant.
Layer 3: Customer Reason Feedback Clustering
Quantitative metrics tell you where refunds are occurring; qualitative return reasons tell you why. When you group unstructured customer return notes, clear root causes emerge: “fabric scratchier than expected,” “zipper sticks at waistline,” or “arrived with broken clips.” Addressing the specific physical or communicative cause directly eliminates the return driver.
8. How to Monitor Refund Trends Over Time
Refund analysis is not a one-time audit; it is a continuous operational discipline. Establishing reliable baseline tracking prevents temporary anomalies from triggering unnecessary business panic while ensuring genuine quality regressions are caught immediately.
Rolling 30, 60, and 90-Day Baselines
Compare your current 30-day refund rate against trailing 60-day and 90-day benchmarks. A rolling baseline smooths out temporary shipping delays, warehouse processing backlogs, or promotional spikes. If a SKU’s 30-day rate deviates by more than 1.5 standard deviations above its 90-day baseline, trigger an automated inspection of recent manufacturing lots.
Monitoring Post-Action Rate Shifts
Whenever you update a product page (adding a video model guide, revising measurements, or clarifying fabric elasticity), annotate the change date in your analytics logs. Track the subsequent 45-day order cohort to verify whether the product page improvement actually reduced return rates without dampening checkout conversion.
9. Practical Actions Merchants Can Take to Lower Refund Rates
Once you have benchmarked your catalog and identified your high-refund items, take targeted operational actions rather than instituting blanket policy changes that hurt brand loyalty.
1. Upgrade Size & Measurement Guidance
Replace generic size tables with exact garment flat measurements (chest width, waist circumference, inseam, sleeve length). Include the model’s height, weight, and the exact size they are wearing in product photography. If customer feedback indicates a garment runs small, explicitly display a notice advising shoppers to size up.
2. Calibrate Visual Assets & Color Rendering
Studio lighting often distorts delicate textile colors and textures. Supplement glamorous studio photography with unedited, natural daylight photos and short walk-around videos showing fabric movement and drape. Clearly describe undertones (e.g., “warm cream with yellow undertones” rather than generic “white”).
3. Strengthen Packaging & Fulfillment Integrity
For fragile home goods, ceramics, and consumer electronics, audit transit packaging. If damage in transit accounts for 20%+ of your refund requests, investing an extra $1.20 in custom molded pulp inserts or corner guards saves $35+ in damaged merchandise, reshipment costs, and lost customer goodwill.
Manually exporting CSV files from Shopify Admin and wrestling with pivot tables in spreadsheets is time-consuming and prone to stale data. RefundLens: AI Refund Insights connects directly to your Shopify store through an automated data ingestion workflow, aggregating refund rates by product, variant, and customer reason notes in real time. It automatically isolates variant skews and clusters feedback patterns so you can protect profit margins without tedious manual calculations.
Frequently Asked Questions About Shopify Refund Rate Benchmarks
What is considered a good or normal refund rate on Shopify?
A normal Shopify refund rate depends entirely on your industry and product category. For online apparel and footwear, an average refund rate of 20% to 30% is common due to sizing and fit uncertainty. For consumer electronics, normal rates range from 8% to 15%. For beauty and personal care items, typical refund rates stay between 4% and 9% (often under 6% for sealed skincare). Comparing your store against a generic cross-industry average is misleading because category dynamics dictate customer return behavior.
What is the difference between a return rate and a refund rate?
A return rate measures the percentage of physical merchandise shipped back to your fulfillment center or warehouse. A refund rate measures the percentage of orders, units, or gross sales revenue credited back to customers financially. A store can issue refunds without physical returns (such as returnless appeasements, damaged-in-transit claims, or cancellations), and customers can return items for exchange or store credit without triggering a cash refund.
Why does my dollar-based refund rate differ from my unit refund rate?
Unit refund rates treat all products equally, whether an item costs $15 or $250. If higher-priced catalog items experience higher return rates than low-cost accessories, your dollar-based refund rate will be substantially higher than your unit refund rate. Conversely, if inexpensive impulse items are frequently refunded without physical return, unit rates may outpace dollar impact.
How does 'bracketing' affect ecommerce apparel refund rates?
Bracketing occurs when shoppers purchase multiple sizes, cuts, or colors of the same garment with the deliberate intention of keeping the best fit and returning the rest. Industry studies from Narvar and the National Retail Federation indicate that over 60% of online apparel shoppers engage in bracketing, which structurally inflates apparel return rates compared to non-sized retail categories.
How should I calculate my Shopify store's refund rate accurately?
To avoid timing distortion, calculate refund rates using cohort analysis rather than simple calendar-month division. Divide the total refunds originating from a specific order cohort by the total sales of that cohort once the return window has matured (typically 30 to 45 days after purchase). Measuring refunds processed in December against December sales distorts metrics because holiday returns peak in January.
Does Shopify provide official refund rate benchmarks for all stores?
Shopify does not publish an official universal refund rate benchmark across its platform. Because Shopify powers millions of merchants ranging from hyper-custom luxury apparel to low-ticket dropshipping, aggregate platform averages would lack practical relevance. Merchants must rely on retail association studies, logistics research, and vertical-specific cohort tracking.
Conclusion
Benchmarking your Shopify refund rate is essential for maintaining a healthy, profitable ecommerce operation. However, blindly comparing your store to a generic cross-industry figure or relying solely on a blended storewide average is an exercise in futility.
By understanding your vertical’s realistic return baseline, whether it is 24% for apparel or 6% for beauty, and systematically disaggregating your data by unit volume, dollar impact, and variant skew, you can identify the exact catalog frictions eating into your net margins. Turn your return data from a frustrating post-purchase cost center into a strategic competitive advantage for product improvement.

Ketul Sindhwad
Digital Marketing & SEO Professional
Ketul Sindhwad is a Digital Marketing & SEO professional focused on ecommerce, analytics, and Shopify. He shares practical guides on understanding customer behavior, product performance, refunds, and other data that can help merchants make better decisions.